

Physical activity in older adults with visual impairment increased by improved home lighting
A new study shows that much of an older person with visual impairment's physical activity is achieved at home. Improved home lighting can help increase those at-home activity rates.

")
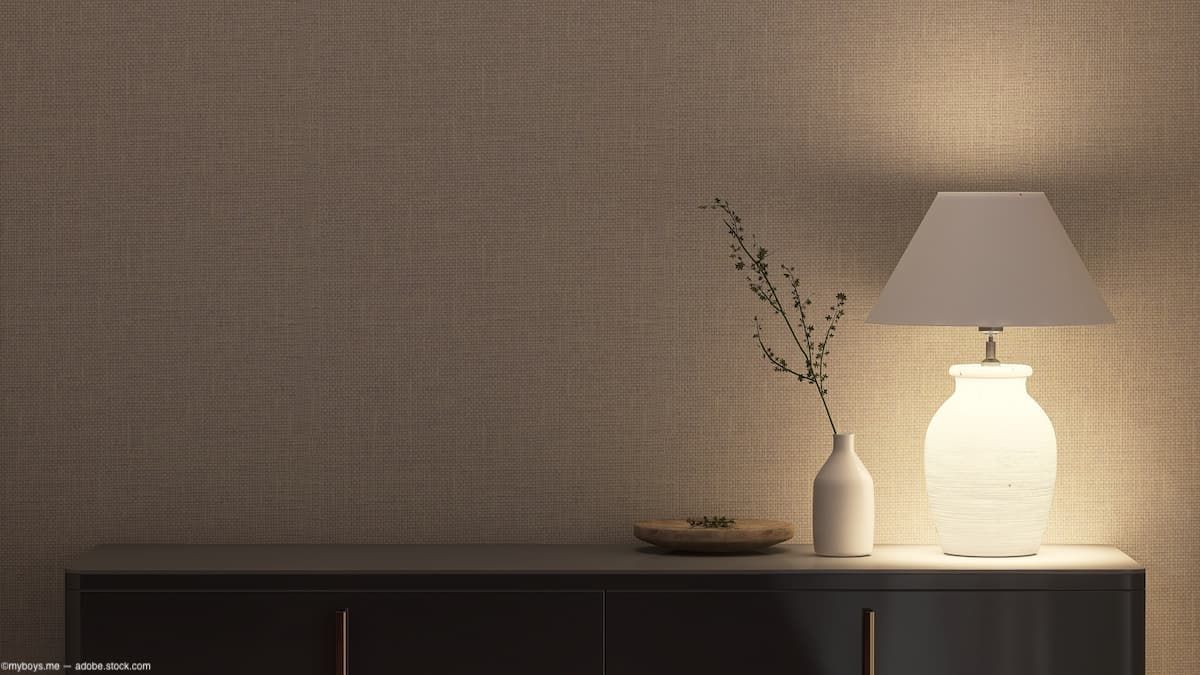
(Image credit: AdobeStock/myboys.me)
Seema Banerjee, PhD, and colleagues evaluated the physical environmental factors that affected visually impaired older individuals in their homes. The results showed that greater measured lighting was associated with higher physical activity levels in older adults with visual impairment who were engaged in home physical activity.1 Banerjee is from the Wilmer Eye Institute, Johns Hopkins University School of Medicine, Baltimore.
The investigators explained, “Older individuals, especially those with disabilities, such as visual impairment, tend to spend most of their time at home performing activities of daily living2-4 and, thus, obtain a sizeable portion of their physical activity at home.5 As such, 1 option for increasing physical activity is to assess and alter the home environment to benefit physical activity.”
Banerjee and colleagues conducted a cross-sectional study of clinical patients who were 60 years of age and older who were glaucoma suspects and those who had been diagnosed with primary glaucoma and who had varying degrees of visual field damage. The patients were recruited from the Johns Hopkins Wilmer Eye Institute Glaucoma Clinic, Baltimore, from September 2013 through March 2015.
The primary outcome was the total in-home steps taken daily by participants. The secondary outcome was the amount of time spent engaged in daily home physical activity and non-sedentary activity.
Results in visually impaired patients
The authors reported that 153 participants (mean age, 71 years; 46% women) were included in the study.
The characteristics of this patient population were that 60% had more than 1 comorbid illness, about one-third took 5 or more prescription drugs, and the median number of steps taken at home daily was 1137. The median integrated visual field sensitivity was 28 decibels, and the median logarithm of the minimum angle of resolution visual acuity in the better eye was 0.05 (20/22 Snellen equivalent).
Regarding the primary study outcomes, the results showed that for every 0.1-log unit increment in average measured home lighting, the participants took 5% more daily steps (rate ratio [RR], 1.05; 95% confidence interval [CI], 1.00-1.10; P = 0.04) and had a 3% faster average daily peak cadence (RR, 1.03; 95% CI, 1.01-1.05; P = 0.01).
The average number of non-sedentary activity minutes (RR, 1.04; 95% CI, 1.00-1.07; P = 0.06), average bout duration (β = 0.03; 95% CI, 0.00-.07; P = 0.06), and activity fragmentation (β = −0.06; 95% CI, −0.13 to 0.00; P = 0.06) showed associations with home lighting. The number of hazards was not associated with any activity metric (steps: RR, 1.14; 95% CI, 0.96-1.34; P = 0.13; peak cadence: RR, 1.00; 95% CI, 0.93-1.08; P = 0.98; and nonsedentary time: RR, 1.11; 95% CI, 0.98-1.26;P = 0.11) or the frequency of hazards.
The authors concluded, “Better lighting was associated with greater physical activity levels. Thus, home environment features, in particular lighting, may influence home physical activity in older adults with visual impairment.”
They called for prospective studies to confirm if home modifications can improve at-home activity.
References:
Banerjee S, Mihailovic A, Miller R, et al. Visual impairment and real-world home physical activity with home environment in an older population. JAMA Ophthalmol. Published online February 8, 2024. doi:10.1001/jamaophthalmol.2023.6436
Graham SE, McCurdy T. Developing meaningful cohorts for human exposure models. J Expo Anal Environ Epidemiol. 2004;14:23-43. doi: 10.1038/sj.jea.7500293
Leech JA, Nelson WC, Burnett RT, et al. It’s about time: a comparison of Canadian and American time-activity patterns. J Expo Anal Environ Epidemiol. 2002;12:427-432. doi:10.1038/sj.jea.7500244
Tsang AM, Klepeis NE. Descriptive statistics tables from a detailed analysis of the National Human Activity Pattern Survey (NHAPS) data. Accessed January 3, 2024. https://www.osti.gov/biblio/642855
RamuluPY, Mihailovic A, West SK, et al. Predictors of falls per step and falls per year at and away from home in glaucoma. Am J Ophthalmol. 2019;200:169-178. doi:10.1016/j.ajo.2018.12.021