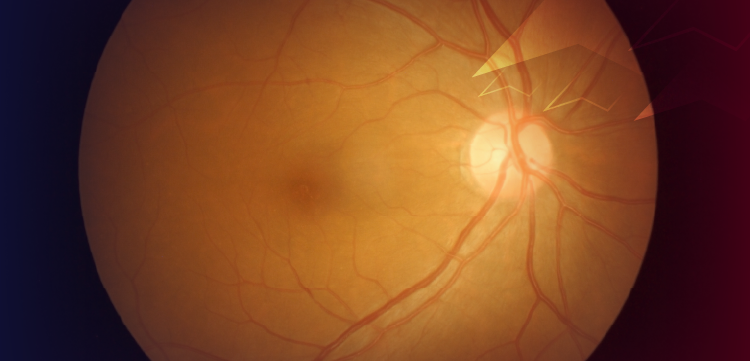
Decreased retinal vascular density linked to moderate-to-severe COVID-19 pneumonia
Investigators identified that patients with moderate and severe SARS-CoV-2 pneumonia have decreased central retinal vascular density compared with patients who were asymptomatic/paucisymptomatic or control subjects.
Miguel Ángel Zapata, MD, from the Ophthalmology Service, Vall d'Hebron University Hospital, Barcelona, Spain, and colleagues from multiple Spanish institutions, identified a retinal effect of SARS-CoV2, ie, that patients with moderate and severe SARS-CoV-2 pneumonia have decreased central retinal vascular density compared with patients who were asymptomatic/paucisymptomatic or control subjects.1
The investigators conducted a case-control study that included adults (age range, 18-55 years) who had COVID-19 confirmed by polymerase chain reaction. The patients were grouped by disease severity: 1, mild (asymptomatic/paucisymptomatic); 2, moderate (hospitalization but no acute respiratory distress); and 3, severe (admission to the intensive care unit with acute respiratory distress and interleukin (IL) 6 values exceeding 40 pg/mL). The control group was comprised of age-matched subjects with negative tests for COVID-19. The vascular density was defined as the percentage of a region occupied by blood vessels in the OCTA en-face images.
Non-invasive observation of the retinal vasculature using optical coherence tomography (OCT) and OCT angiography (OCTA) facilitated evaluation of the retinal microvascular plexus in this study.
Decreased vascular density
The primary finding was that the patients in groups 2 and 3, comprised of 24 and 21 patients, respectively, had reduced fovea-centered vascular density compared with 24 patients in group 1 and 27 control subjects. No funduscopic lesions were seen on imaging.
The authors reported that the fovea-centered vascular density was significantly lower in the presence of more severe disease, specifically, control group vs. group 2, 16.92 vs 13.37, respectively (P = 0.009); control group vs. group 3, 16.92 vs .13.63, respectively (P = 0.026); group 1 vs. group 2, 17.16 vs. 13.37, respectively (P = 0.006); and group 1 vs. group 3, 17.16 vs 13.63, respectively (P = 0.017).
The authors noted that the clear differences between the vascular densities and infection severity and may be an “an indirect consequence of the infection,” in that hypoxia and hyperoxia can affect the vascular density.2-4 Another was that the patients with moderate/severe disease required extended oxygen supplementation; however, the study was conducted after symptom resolution, rendering unclear the cause of the lower vascular density in groups 2 and 3.
Because previous studies have suggested that the vascular density in the central retina may be a possible vascular biomarker in diabetes, chronic kidney disease, inflammatory bowel disease, amyloidosis, or Alzheimer’s disease, Dr. Zapata and colleagues questioned if the vascular density might be a biomarker for microvascular abnormalities following COVID-19.5-8 Longitudinal studies are needed to determine this.
References
1. Zapata MA, Banderas Garcia S, Sánchez-Moltalvá A, et al. Retinal microvascular abnormalities in patients after COVID-19 depending on disease severity. Br J 2022; 106 i-ii Published Online First: 22 Mar 2022. doi: 10.1136/bjophthalmol-2022-321436
2. Hagag AM, Pechauer AD, Liu L, et al. Oct angiography changes in the 3 parafoveal retinal plexuses in response to hyperoxia. Ophthalmol Retina 2018; 2:329–36. doi:10.1016/j.oret.2017.07.022
3. Xu H, Deng G, Jiang C, et al. Microcirculatory responses to hyperoxia in macular and peripapillary regions. Invest Ophthalmol Vis Sci 2016;57:4464. doi:10.1167/iovs.16-19603
4. Ting DSW, Tan GSW, Agrawal R, et al. Optical coherence tomographic angiography in type 2 diabetes and diabetic retinopathy. JAMA Ophthalmol 2017;135:306. doi:10.1001/jamaophthalmol.2016.5877
5. Vadalà M, Castellucci M, Guarrasi G, et al. Retinal and choroidal vasculature changes associated with chronic kidney disease. Graefes Arch Clin Exp Ophthalmol 2019;257:1698–1687. doi:10.1007/s00417-019-04358-3
6. Nakayama LF, Bergamo VC, Conti ML, et al. The retinal foveal avascular zone as a systemic biomarker to evaluate inflammatory bowel disease control. Int J Retina Vitreous 2019; 5:16. doi:10.1186/s40942-019-0168-9
7. Tei M, Maruko I, Uchimura E, et al. Retinal and choroidal circulation determined by optical coherence tomography angiography in patient with amyloidosis. BMJ Case Rep 2019;12. doi:doi:10.1136/bcr-2018-228479. [Epub ahead of print: 21 Feb 2019].
8. Zhang YS, Zhou N, Knoll BM, et al. Parafoveal vessel loss and correlation between peripapillary vessel density and cognitive performance in amnestic mild cognitive impairment and early Alzheimer's disease on optical coherence tomography angiography. PLoS One 2019; 14:e0214685. doi:10.1371/journal.pone.0214685
Newsletter
Keep your retina practice on the forefront—subscribe for expert analysis and emerging trends in retinal disease management.


