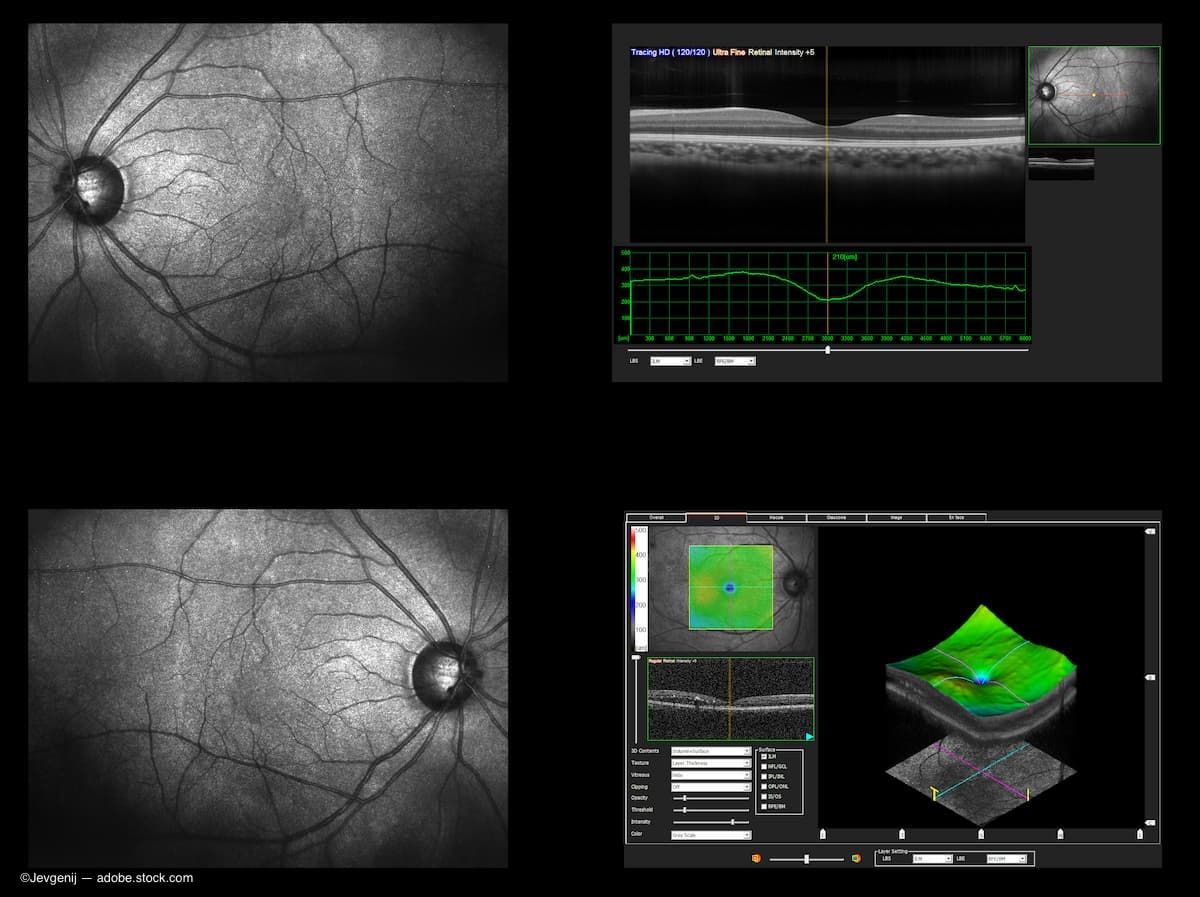
Study finds significant variance across imaging modalities
A single, consistent modality leads to better geographic atrophy tracking.
A single, consistent modality leads to better geographic atrophy tracking. (Image Credit: Adobe Stock/Jevgenij)

Reviewed by Noor Chahal, BS
Fundus autofluorescence (FAF) may be underreporting the sizes of geographic atrophy across various phenotypic features, according to Noor Chahal, BS, at the 2023 Association for Research in Vision and Ophthalmology Annual Meeting.
Chahal, from the University of California San Francisco School of Medicine, and colleagues compared the results of GA measurements obtained with color fundus photography, FAF, and infrared reflectance. They evaluated the agreement among measurements obtained from the imaging modalities, emphasizing the relationship with phenotypic GA features.
During the METforMIN clinical trial (NCT02684578), Chahal said that he and his colleagues analyzed findings from 170 color fundus photographs, 185 FAF images, and 185 infrared reflectance images. The images were obtained from
128 eyes from 77 patients with GA. Two independent masked graders measured the areas of GA. The FAF images were measured manually and semiautomatically using RegionFinder Software (Heidelberg Engineering, Inc).
Images were then stratified based on the GA focality, homogeneity, size, and color to identify any significant differences in measurements between the semiautomatically graded fundus autofluorescence images and other methods. Homogeneous lesions were defined as GA lesions with homogeneous hypofluorescence on fundus autofluorescence. Conversely, nonhomogeneous lesions were defined as GA lesions with mixed hypo- and hyperfluorescence on fundus autofluorescence, Chahal explained.
Results of image comparisons
The measurement results of the areas of GA by modality were as follows: color fundus photographs, 9.18 ± 8.11 mm2; manually measured FAF images, 8.75 ± 7.32 mm2; semiautomatically graded FAF images, 7.02 ± 5.52 mm2; and infrared reflectance images, 8.76 ± 7.37 mm2. The investigators reported that the 4 methods had excellent intergrader agreement (intraclass correlation coefficient, > 0.99) within the same modality. The semiautomatic gradings of the FAF images (7.02 ± 5.52 mm2) were significantly lower than the color fundus photographs (9.18 ± 8.11 mm2, P = .001), manually graded FAF (8.75 ± 7.32 mm2, P = .004), and the infrared reflectance (8.76 ± 7.37 mm2, P = 0.003) image measurements.
The same relationship was seen in the unifocal, multifocal, and nonhomogeneous GA lesions. However, among the 53 homogeneous GA lesions, the semiautomatically measured autofluorescence results did not differ significantly from those of the fundus photographs (difference,
–0.88 ± 1.27 mm2; P = .06), manually measured autofluorescence results (difference, –0.51 ± 0.68 mm2; P = .27), and infrared reflectance results (difference, –0.45 ± 0.71 mm2; P = .21).
In addition, gray GA lesions (n = 5) had the highest cross-modality differences compared with measurements obtained using semiautomated FAF. The measurements from the fundus photographs showed a difference of –6.29 ± 5.18 mm2. Those from the manual autofluorescence measured
–8.43 ± 1.96 mm2 and from the infrared reflectance measured –6.41 ± 2.88 mm2.
“Although each method had excellent intergrader agreement, the GA sizes measured semiautomatically on autofluorescence images were significantly lower than in other imaging modalities,” the authors concluded. Clinicians and researchers are encouraged to use a single, consistent modality for disease monitoring and progression and to consider GA phenotype when interpreting results. •
Noor Chahal, BS
e: noor.chahal@ucsf.edu
Chahal is from the University of California San Francisco School of Medicine. Chahal has no financial interest in this subject matter.
Reference:
Chahal, N; Shen, L L, Kennan, J, et al. Comparison of fundus photography, autofluorescence, and infrared imaging in various phenotypic features of geographic atrophy. Paper presented at: the 2023 Association for Research in Vision and Ophthalmology Annual Meeting; April 22–27, 2023; New Orleans, LA. Accessed May 23, 2023. https://www.arvo.org/annual-meeting/program/online-planner/

Newsletter
Keep your retina practice on the forefront—subscribe for expert analysis and emerging trends in retinal disease management.